SPIN ESR 3.3: Detection and characterization of seismic signals with dense arrays of new seismological instruments
Name: Julius Grimm 
Institution: ISTerre, University of Grenoble Alpes (UGA)
Email: julius.grimm@univ-grenoble-alpes.fr
PhD title and defense date: Detection and Characterization of Seismic Signals with Distributed Acoustic Sensing (DAS), June 16, 2025.
Introduction
My name is Julius and I am currently pursuing a PhD degree in seismology at ISTerre, a research institute located in Grenoble, France. Originally I am from Germany, where I also obtained my Bachelor’s degree in Geotechnology at TU Berlin. Afterwards I did a Joint Master in Applied Geophysics, where I had the opportunity to spend semesters at TU Delft, RWTH Aachen and ETH Zurich.
My research is focused on the detection and characterization of signals for multi-station seismic networks. Large-N arrays and increasing computing power gives rise to new possibilities to extract information from dense recordings of the seismic wavefield, allowing us to better understand the underlying processes. The methods we develop are generic and applicable to different types of instruments and study sites, such as glaciers, volcanoes, faults and even in cities for monitoring anthropogenic noise sources.
In my free time I like to do outdoor sports. The mountains around Grenoble are ideal for skiing in winter and hiking in summer. I also play for the local chess club, a perfect hobby for bad weather days.
Publication
Grimm, J., Poli, P., & Jousset, P. (2023). Detecting seismo-volcanic events based on inter-channel coherency of a DAS cable (No. EGU23-9089). Copernicus Meetings.
Grimm, J., & Poli, P. (2022). Making sense of urban DAS data with clustering of coherence-based array features. In EGU General Assembly Conference Abstracts (pp. EGU22-5743).
Grimm, J., Paitz, P., Martin, E., Edme, P., Walter, F., Fichtner, A., & Lipovsky, B. (2021, December). Cryoseismic Event Analysis on Distributed Strain Recordings Leveraging Unsupervised Clustering. In AGU Fall Meeting Abstracts (Vol. 2021, pp. NS12A-04).
Grimm, J. (2021). Cryoseismic Event Analysis on Distributed Strain Recordings Leveraging Statistical Learning Methods (Master’s thesis, ETH Zurich). Retrieved from http://resolver.tudelft.nl/uuid:b98362cd-ab70-4158-9055-733e86d29b13
Research progress
Spectral width is a measure of how dominant the strongest source is in comparison to weaker sources in the same time window. It can be computed for time-frequency bins by decomposing the signal coherence matrix. A low spectral width is an indicator for a an active source.
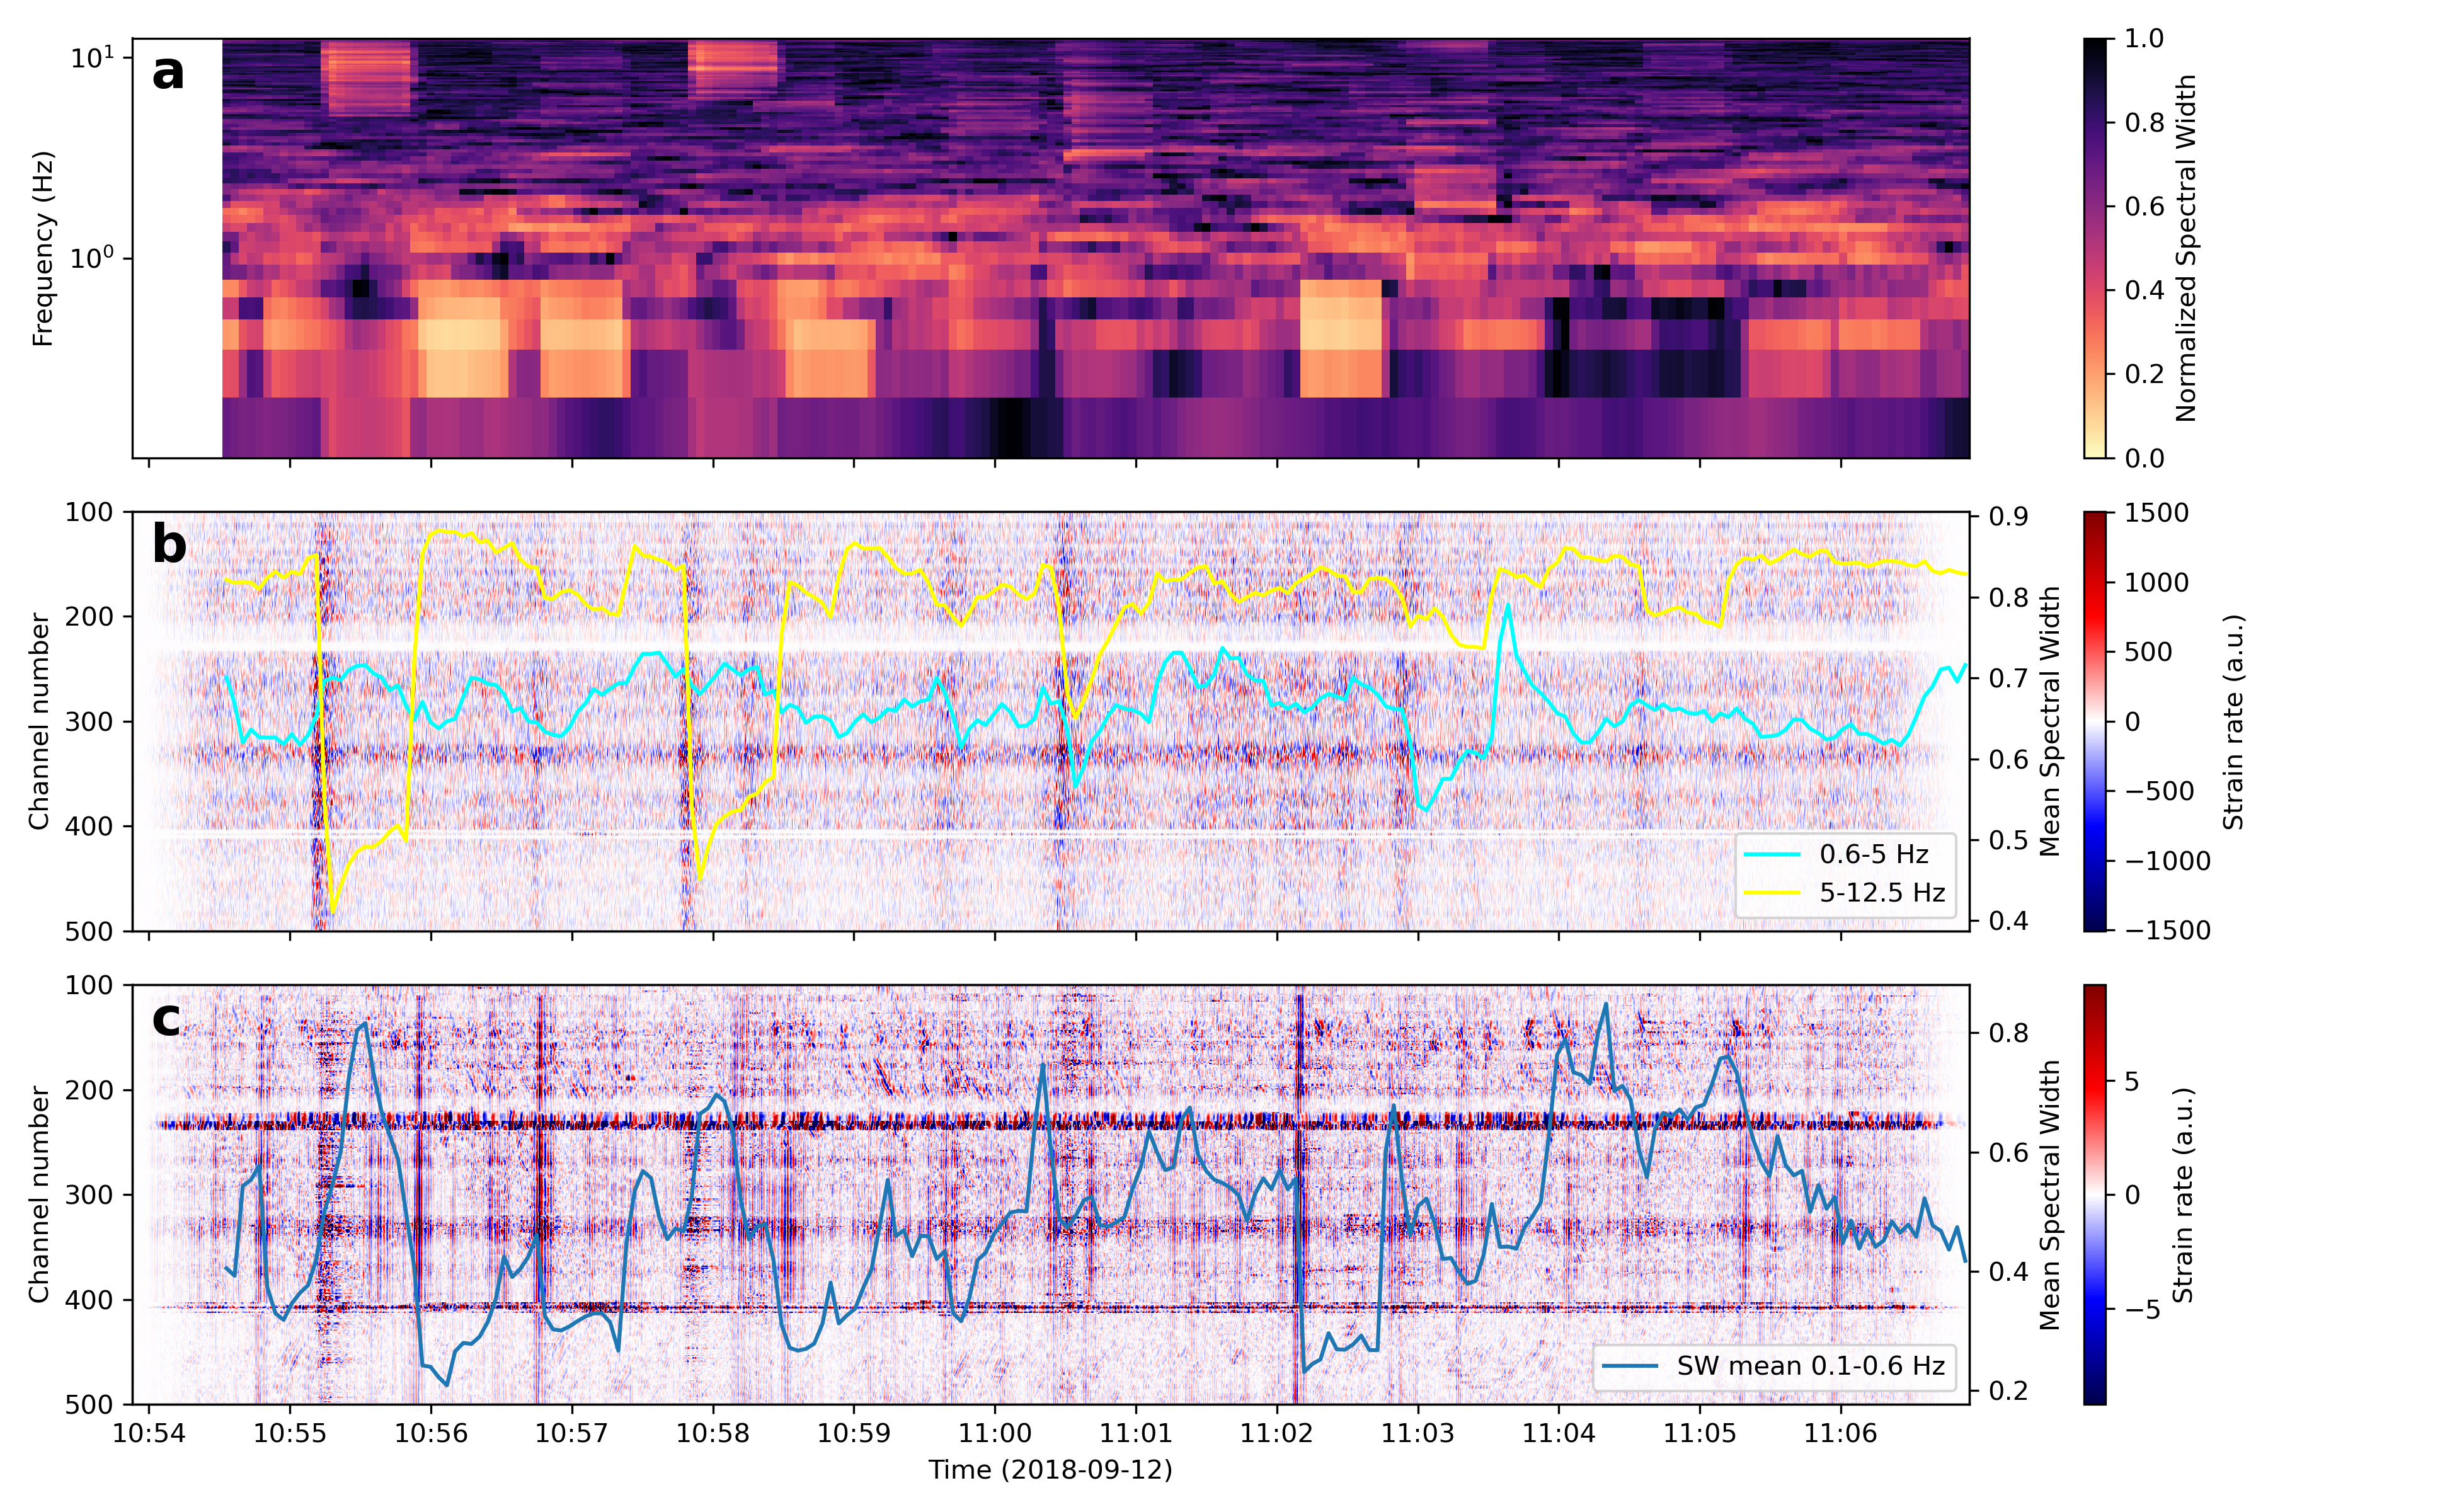 Plot a) in the figure below shows the spectral width plot for a 12 min window of DAS data recorded at Mount Etna, Italy. The Spectral Width has been normalized at each frequency to reduce the effect of the 1-3 Hz tremor. In the filtered DAS data, degassing events (up to 0.1-10 Hz) and short tremor pulses (0.1-0.6 Hz) are visible. The mean of the spectral width for different frequency bands is superimposed in plots b) and c). Drops in the curve signify a detection. This allows us to automatically differentiate between different transients inside the tremor.